These instructions will allow you to browse through RR Lyrae variable stars in your region of interest using TOPCAT.
Open the TAP Query Window.

Select the ARI-Gaia service.
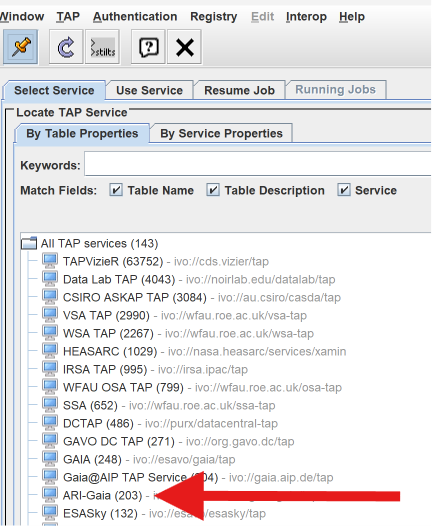
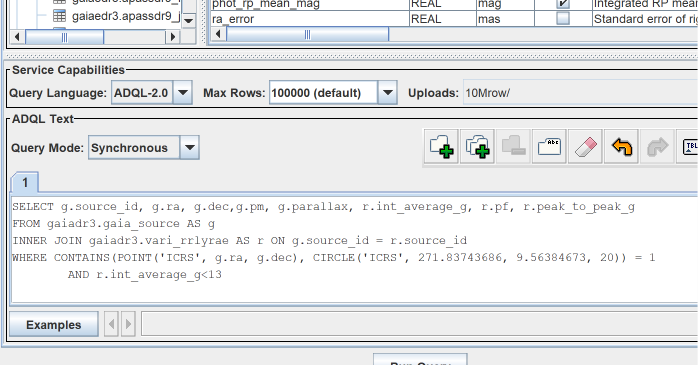
Specify the RA and Dec of the center of your region of interest, then enter the following ADQL query:
SELECT
    g.source_id,
    g.ra,
    g.dec,
    g.pm,
    g.parallax,
    r.int_average_g,
    r.pf,
    r.peak_to_peak_g
FROM gaiadr3.gaia_source AS g
INNER JOIN gaiadr3.vari_rrlyrae AS r
    ON g.source_id = r.source_id
WHERE CONTAINS(
    POINT('ICRS', g.ra, g.dec),
    CIRCLE('ICRS', 271.83743686, 9.56384673, 20)
) = 1
AND r.int_average_g < 13
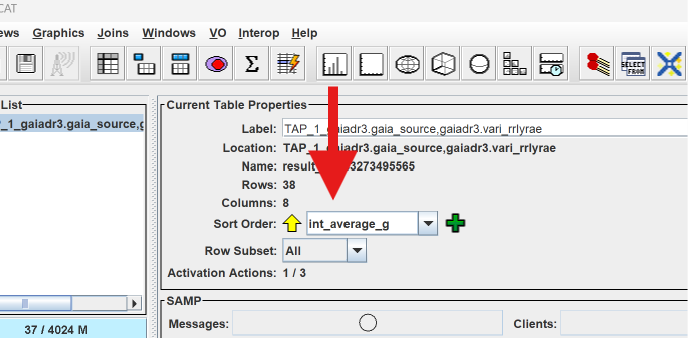
Run the query and close the TAP window. Then sort the resulting table by int_average_g in ascending order.
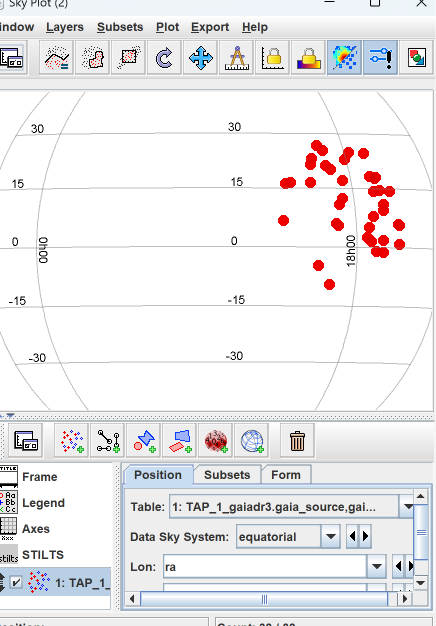
Next, plot the variable star positions on the Sky Plot.
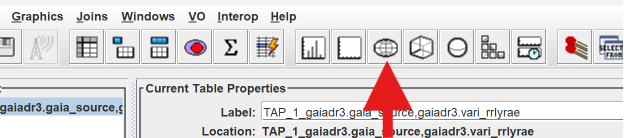
The default should display the positions in the equatorial coordinate system.
Double-click your table to open it. Verify that it is ordered by the int_average_g column.
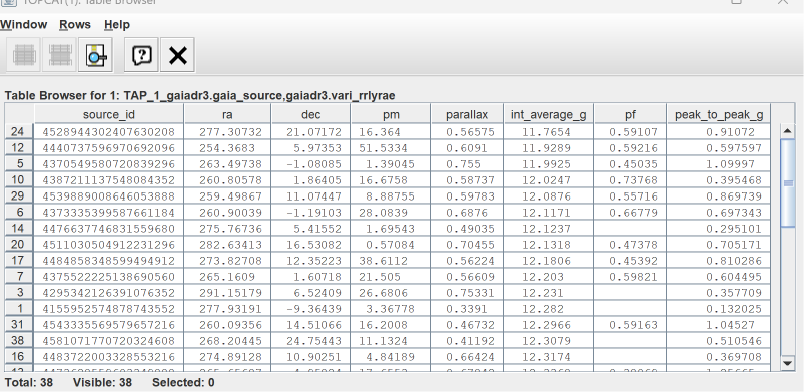
The table lists the RR Lyrae variable stars, with the brightest stars at the top. It also includes each star’s oscillation period (pf) and peak-to-peak brightness variation (peak_to_peak_g).