This document assumes you have calibrated your light images as described in SOAR Photometry, Part 1.
In this example, we obtain the light curve for the variable star SZ Lyn, collected on November 22, 2024.
Large Ensemble Photometry
Observatory Information
- Launch LEPhot.
- Under the Observatory Info tab, verify or modify the information as needed.
Consult the FITS header as described in Part 1. If the focal length is uncertain, it can be obtained independently from the plate-scale information using astrometry described in Part 1.
The detector width and height can be obtained from the FITS header:
width (mm) = width (pixels) × pixel size (microns) / 1000
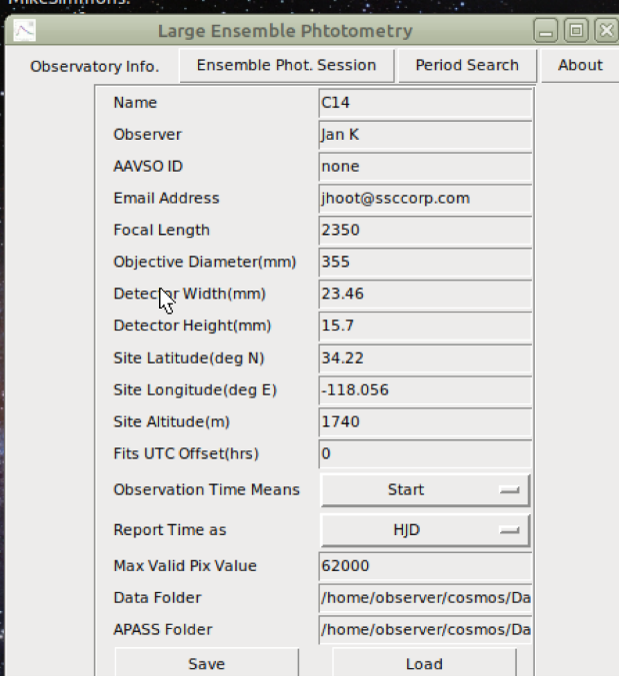
- After confirming that this information works during initial processing, return to this tab and press Save.
Ensemble Photometry Session
- Click the Ensemble Phot. Session tab.
- Press New Session. All information is reset.
- Press Load Ref. Image.
Note: You may need to change the file type to All Files in order to see files with the
.fitsextension.
Choose any one of your calibrated images (avoid the first or last image in the sequence). Verify that the fields populate with the correct information after loading the reference image.
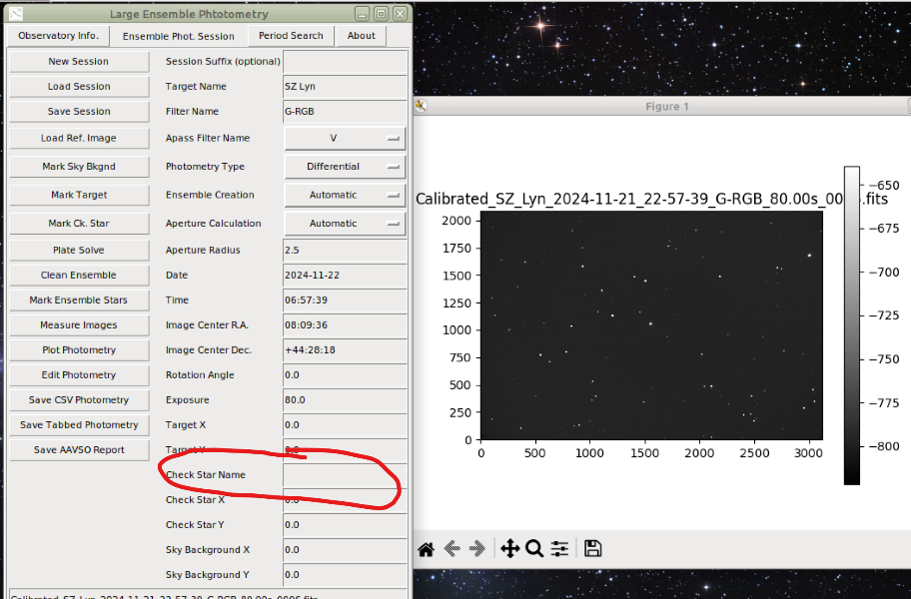
Important: If your image files contain spaces in their filenames, the application may hang during later steps without explanation. Consult Part 1 for instructions on replacing spaces with underscores.
Important: The Check Star Name field cannot remain empty. If it is left empty, the application may hang during later steps without explanation. The name itself is arbitrary, but it is best practice to choose a known check star near your object from the AAVSO APASS catalog.
Choosing the Check Star
- Go to the AAVSO Variable Star Plotter:
- Type the name of your object (in this example,
SZ Lyn) or its RA and DEC coordinates. Enter the field scale, preferably matching the size of your image field.
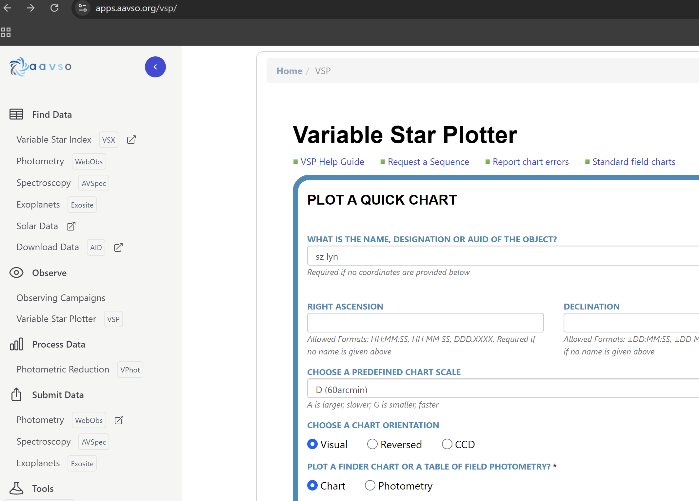
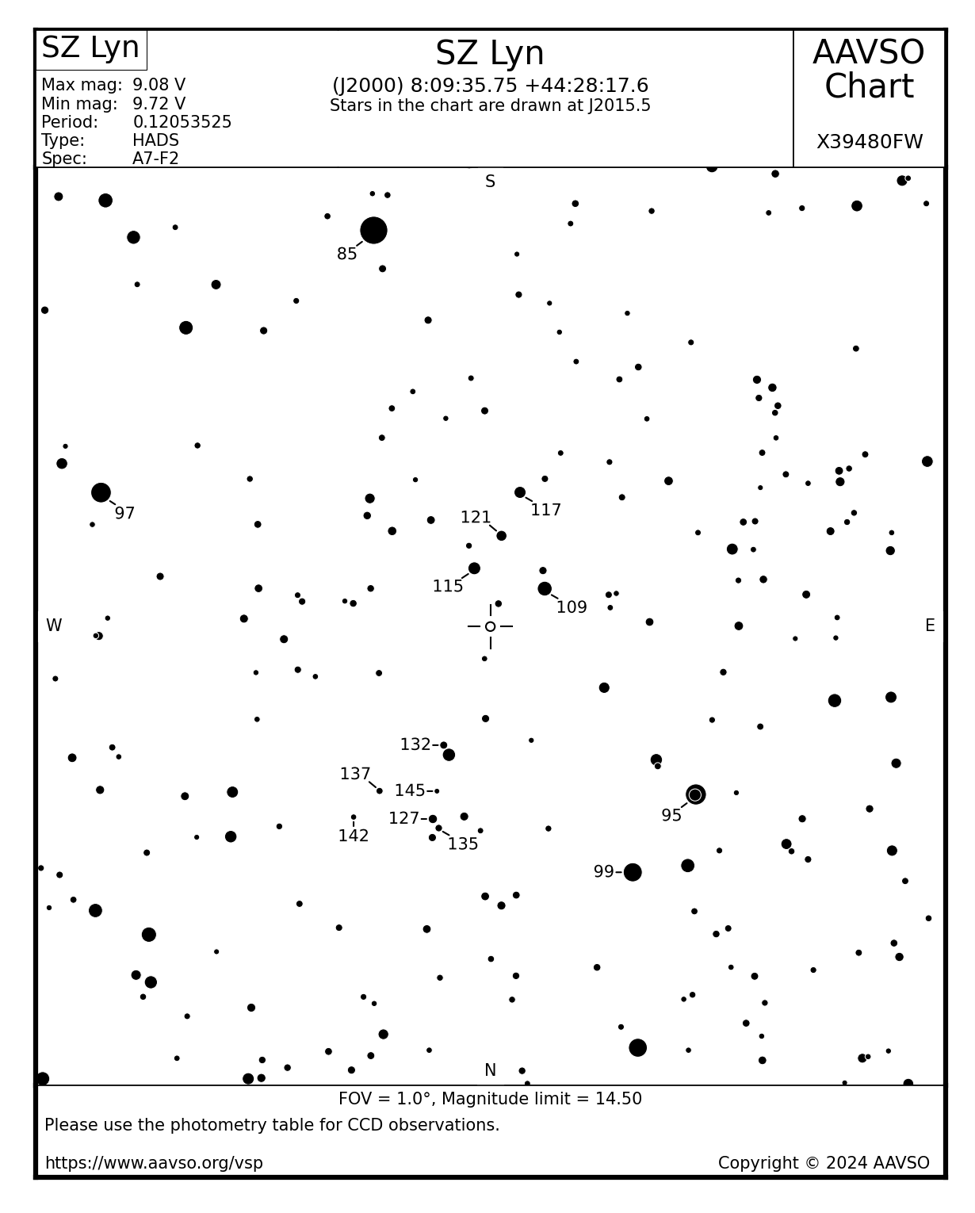
- The center of the chart will be on your target object. Suitable check stars are labeled with numbers that approximately indicate their magnitudes.
For example, the star labeled 109 next to SZ Lyn is approximately magnitude 10.9.
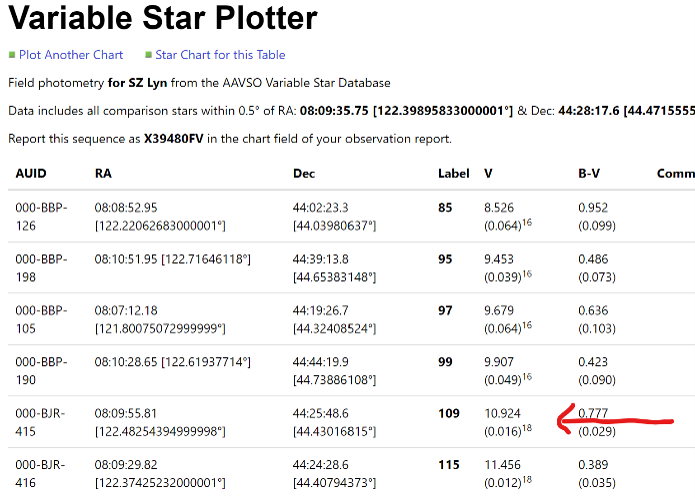
- Click Photometry Table for This Chart.
Locate star 109, whose AUID is:
000-BJR-415
Enter this value into the Check Star Name field in LEPhot.
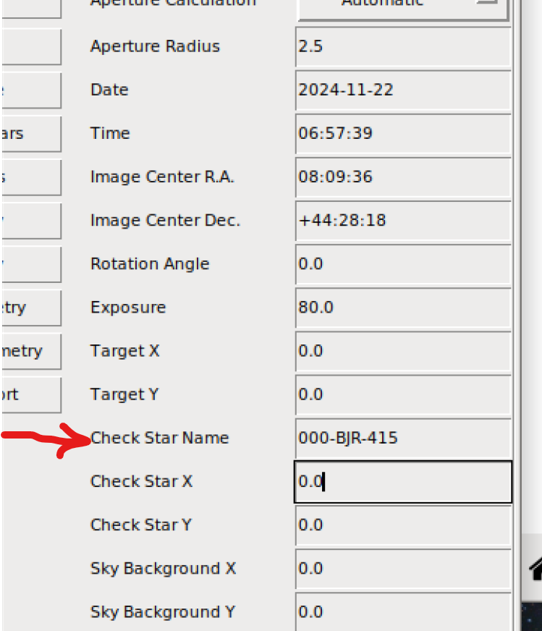
Marking the Reference Points
-
Explore the zoom and pan controls if needed.
-
Press Mark Sky Bkgnd and click on a region containing only sky background.
-
Press Mark Target and click on your target star.
-
Press Mark Ck. Star and click on the check star selected from the AAVSO chart.
Recognizing the check star may take some effort. If necessary:
- regenerate the AAVSO chart with a different scale
- compare star patterns carefully
- remember that the chart orientation may not match your image orientation
- Verify the remaining fields:
- Apass Filter Name should match your filter.
- Photometry Type should be set to
Differential. - Other fields should remain
Automatic.
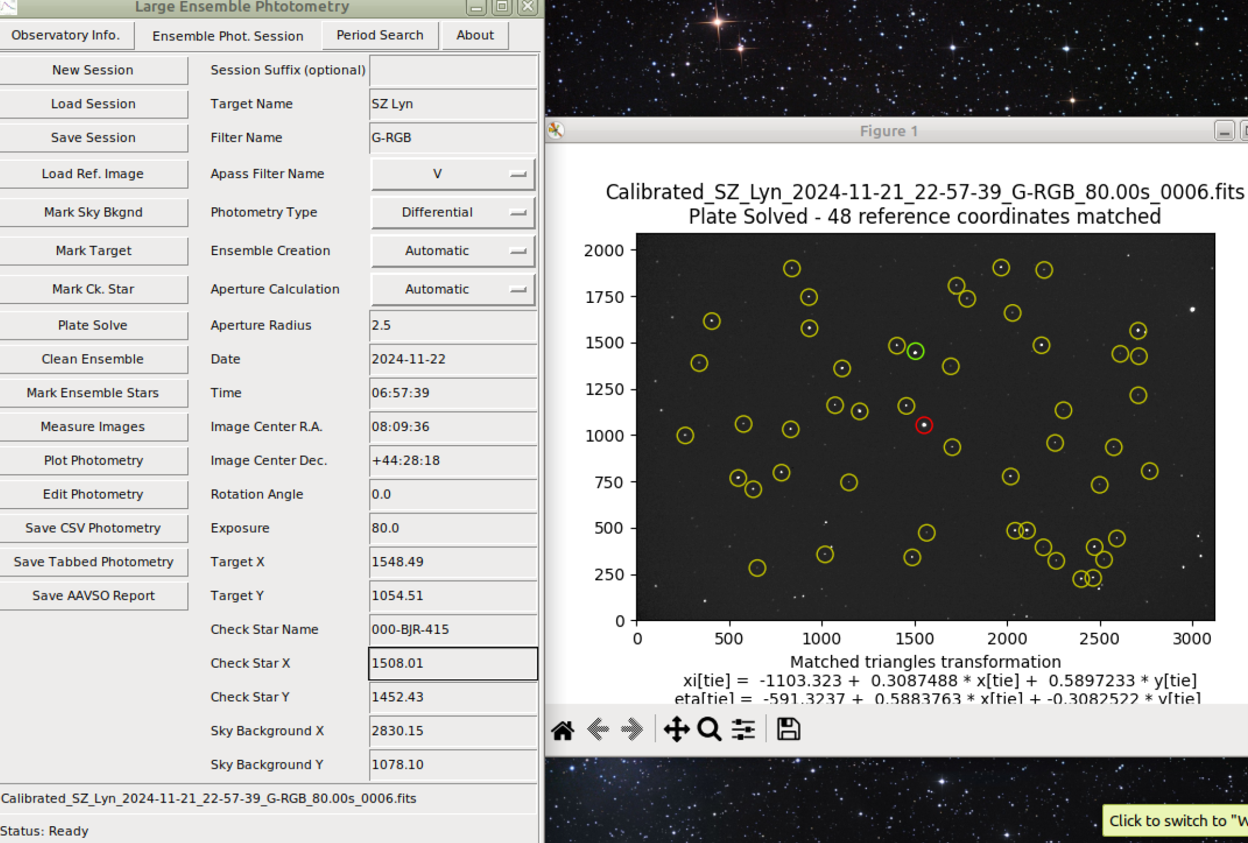
- Press Plate Solve.
The various XY coordinates correspond to the points clicked on the image. The red and green circles indicate the target and check stars.
Troubleshooting
If the application hangs:
- Verify that Check Star Name is not empty.
- Verify that the reference image filename contains no spaces.
If No Solution is found:
- Verify that the focal length agrees with the astrometric plate scale determined in Part 1.
- Verify that the observatory information is correct.
- Verify that the sensor width and height are entered correctly in millimeters.
Measuring the Images
- Press Measure Images.
In the dialog box, shift-click to select all calibrated images. You may need to change the file type to All to see .fits files.
If the application hangs, verify that none of the filenames contain spaces.
LEPhot uses the known magnitudes of APASS stars within the image and performs a fit to determine the magnitudes of the target and check stars.
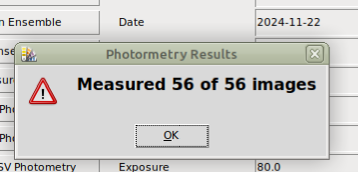
When processing is complete, a confirmation dialog will display the number of images measured.
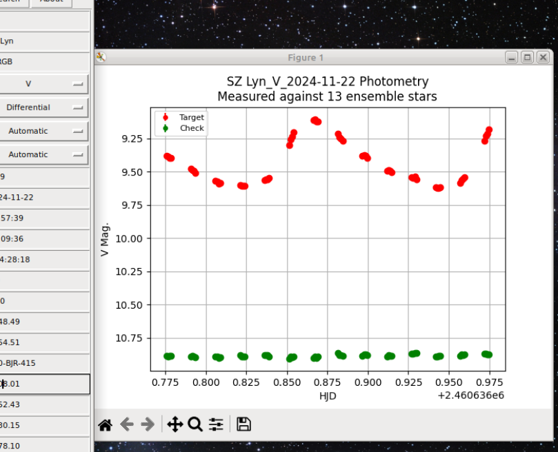
- Press Plot Photometry to display the resulting light curve.
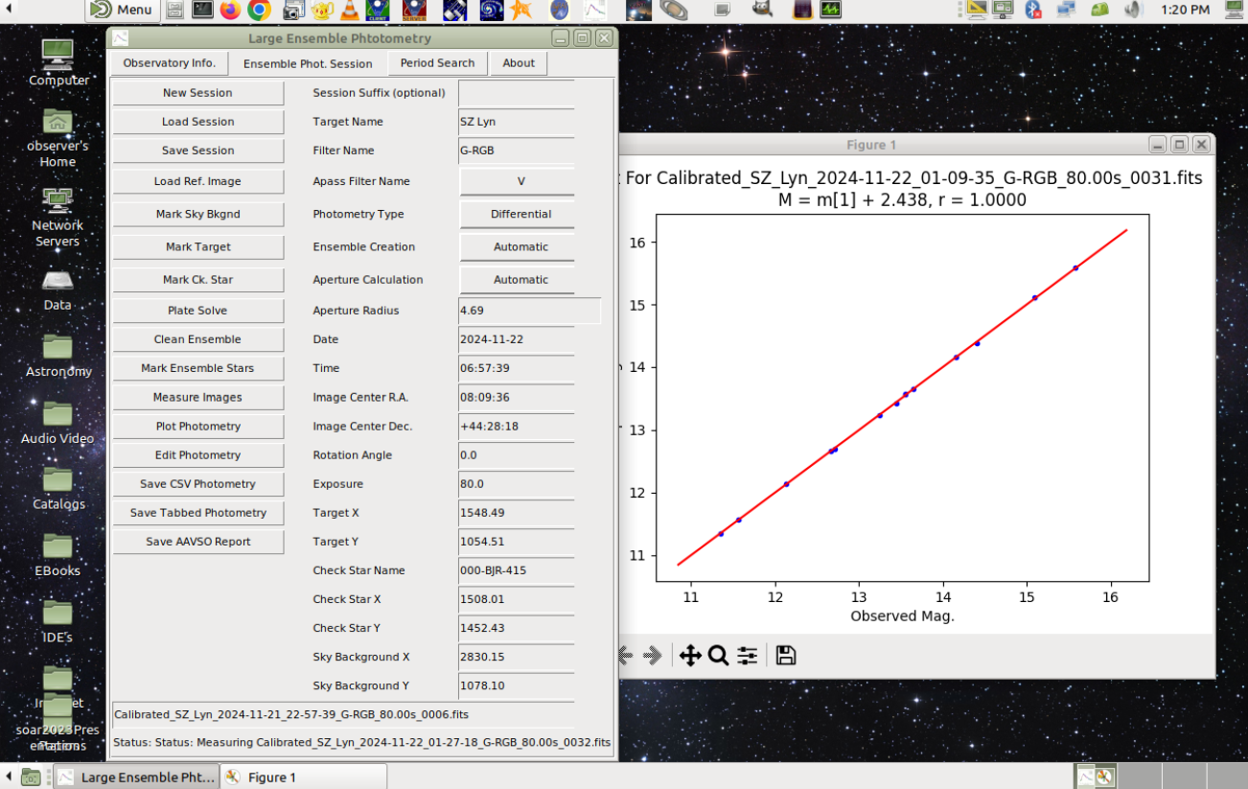
- Press Save … to save the light curve in:
- CSV format
- Tabbed format
- AAVSO format
- Press Save Session.
Period Search
-
Press New Fit to clear the fields.
-
Press SelectSessions and choose the session saved in the previous section.
Multiple session files from different observing times may be selected for the same object.
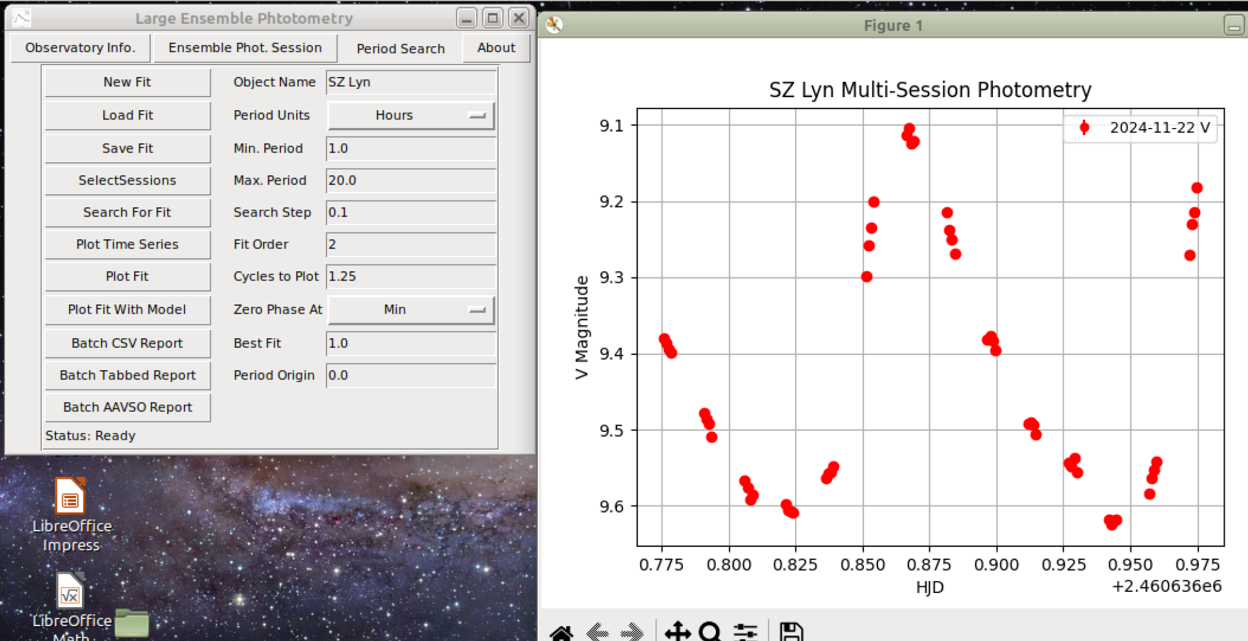
- Press Plot Time Series to display the light curve.
- Press Search For Fit.
Iteratively adjust:
- Minimum Period
- Maximum Period
- Search Step
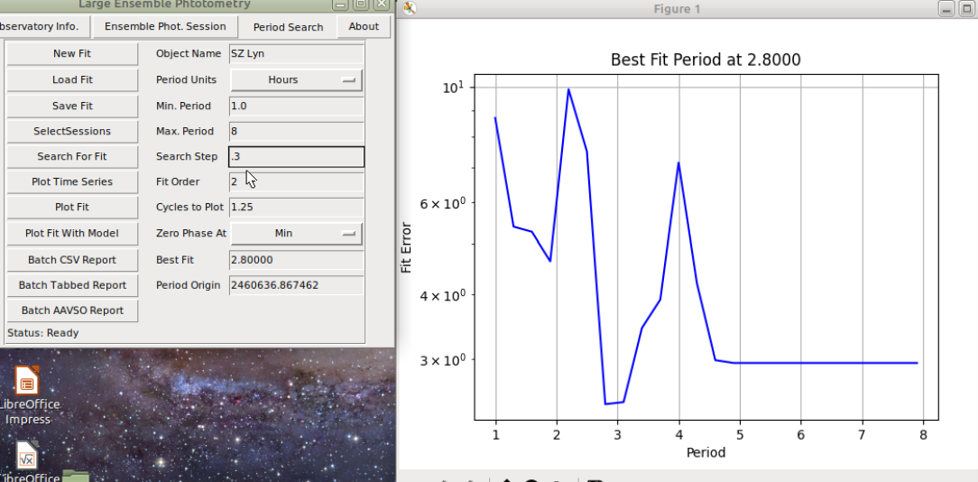
The blue curve indicates the fitting error as a function of period.
The lowest fit error occurs at approximately:
Period ≈ 2.8 hours
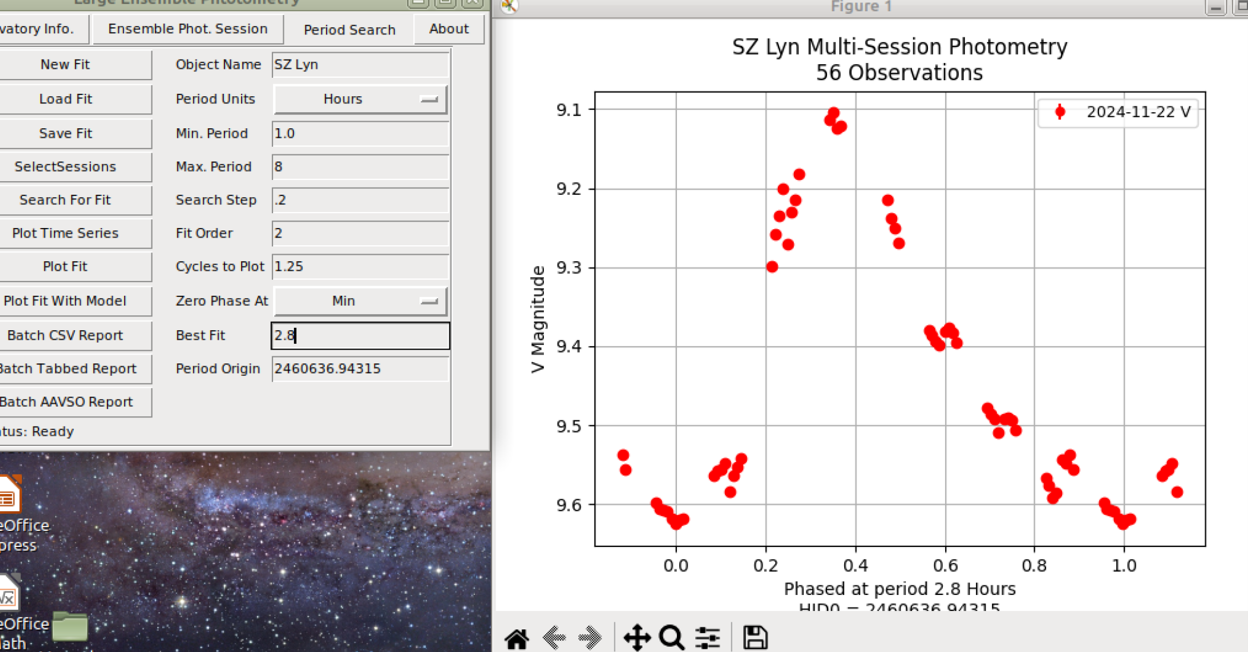
Enter this value into the Best Fit field.
- Press Plot Fit.
The fit produces a phase plot of the light curve.
The repeating data points may appear slightly offset. Fine-tune the Best Fit value manually:
- Enter a new value.
- Press Plot Fit.
- Repeat until the phase curve becomes as smooth as possible.
The smoothest curve in this example is obtained with:
Period = 2.89 hours
- You may also perform a polynomial fit, for example of order 2, to produce a smooth model of the light curve.
Conclusion
For this data set, we conclude that SZ Lyn has a period of approximately 2.89 hours. Continue to Part 4.