These instructions assume that you have calibrated your light images as described in SOAR Photometry, Part 1.
In this example, we will perform photometry on the target star at the center of the field using AutoStar Image Processing. Make sure that your calibrated images are still loaded in the Group where you left off in Part 1.
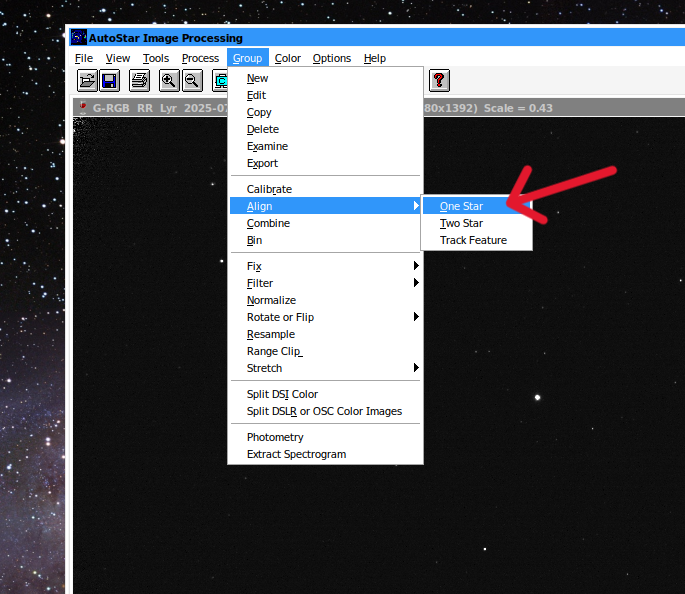
Select Group → Align → One Star.
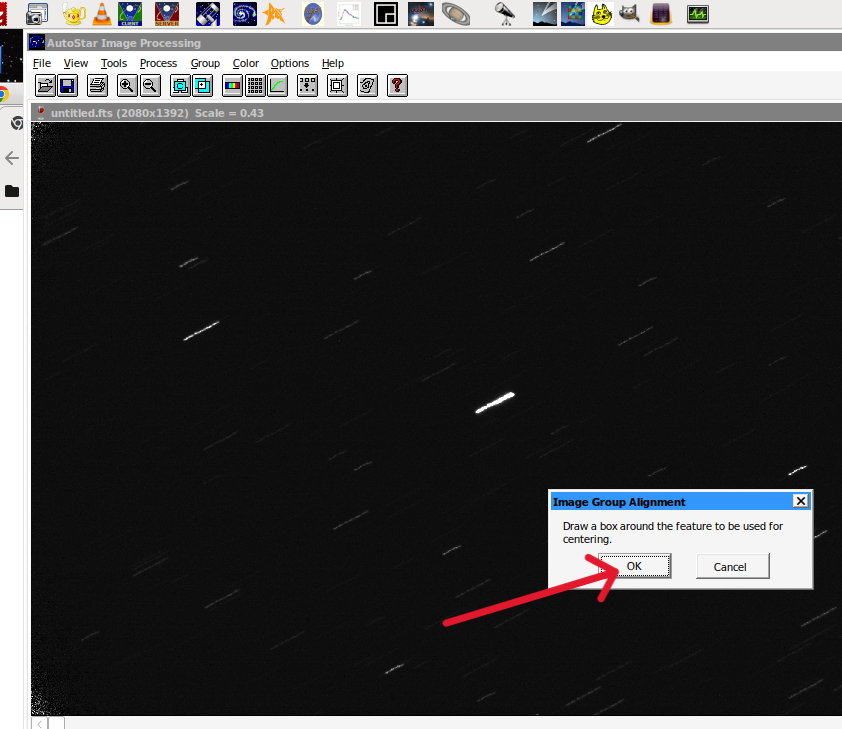
The program will step through all the images and display their merged result. The star trails show how the mount drifted or the telescope tube flexed, causing the stars to appear streaked.
Click OK, then click and drag to draw a box around the single bright streak near the center. As soon as you release the mouse button, the program will align the images.
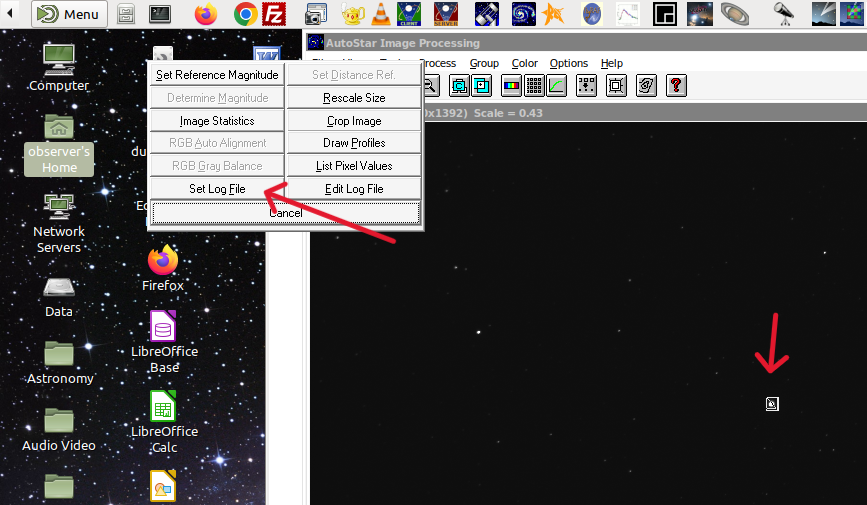
After the images have been aligned, draw a square around the target star and select Set Log File.
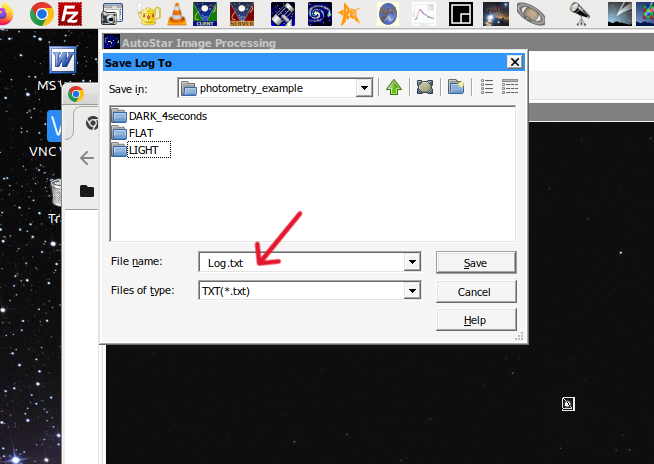
Use the default log-file name or enter a name of your own.
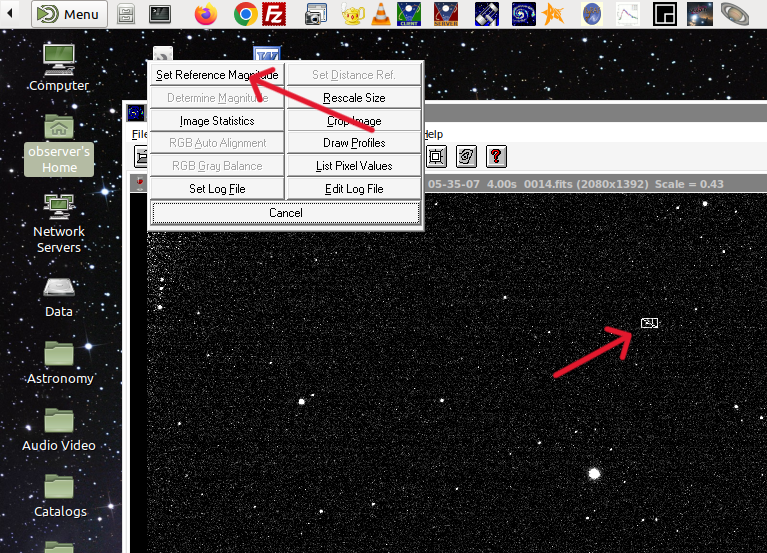
Next, draw a square around a reference star whose magnitude is known. You can find its magnitude using an AAVSO plot chart.
Select Set Reference Magnitude.
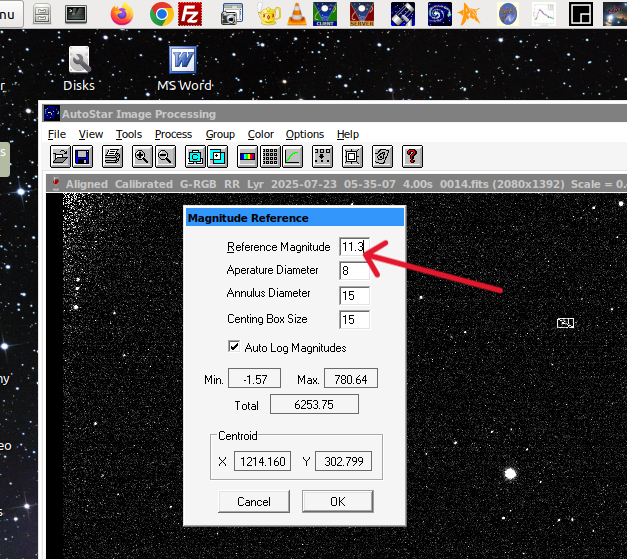
The reference star used in this example has a magnitude of 11.3. Enter the magnitude and click OK.
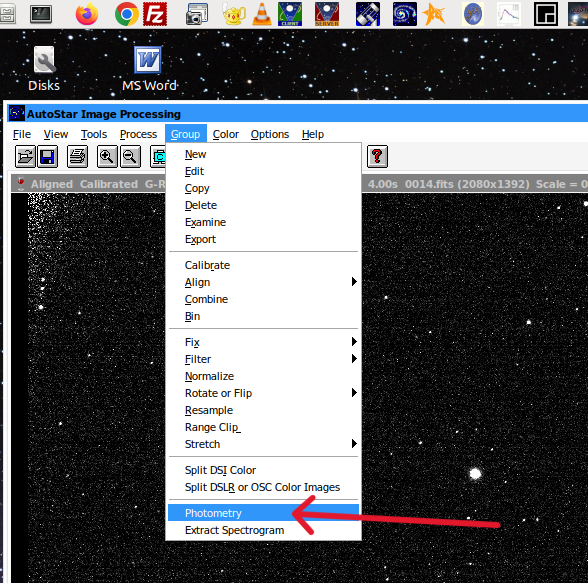
Select Group → Photometry.
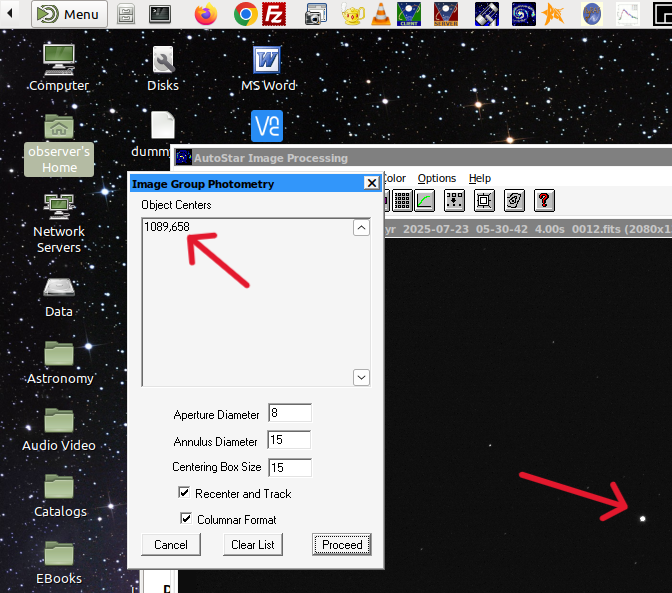
Click at the center of the target star. Verify the photometry settings, then click Proceed.
After the program finishes processing the images, you can create the light curve by opening the log file in Excel.
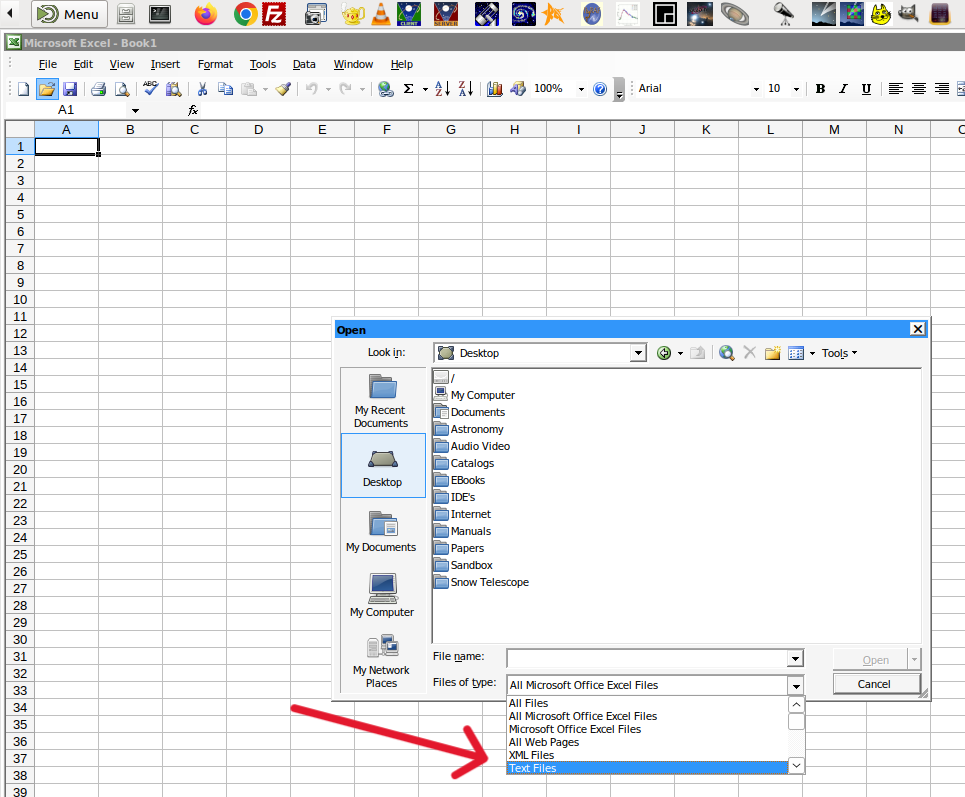
In Excel, open the log file and make sure that text files are visible in the file-type menu.
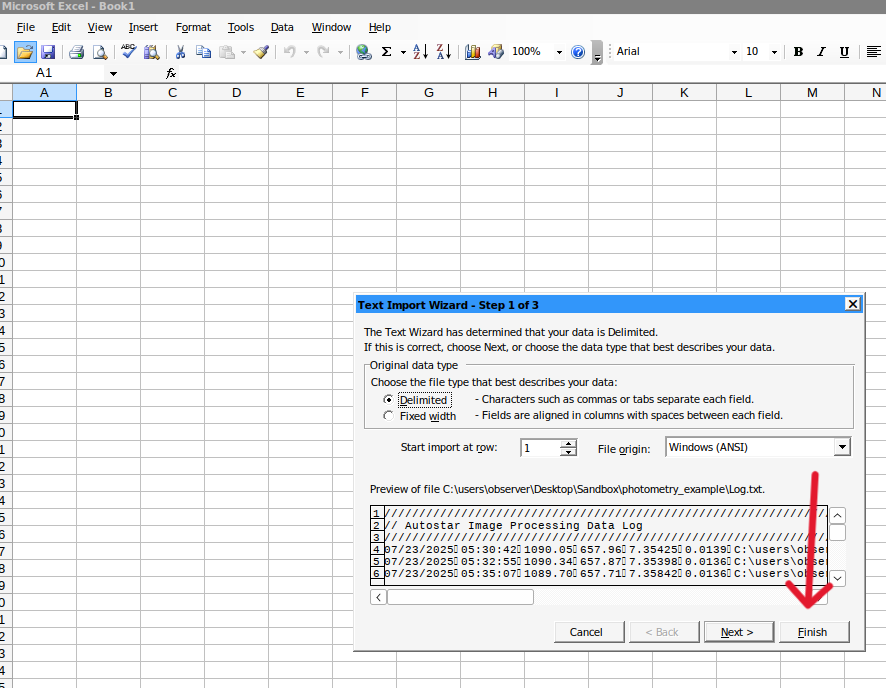
The Text Import Wizard will display the contents of the log file. Accept the detected settings and click Finish to load the measurements into Excel.
The imported data can now be used to plot the target star’s brightness as a function of time.
Another method of creating the light curve is described in SOAR Photometry, Part 3.