These instructions will allow you to construct an H-R diagram of a large sample of stars with absolute magnitudes corrected for distance in TOPCAT. You can also view the spectrum of any selected star and inspect its image to compare its color with its location on the H-R diagram.
Open the TAP Query Window.

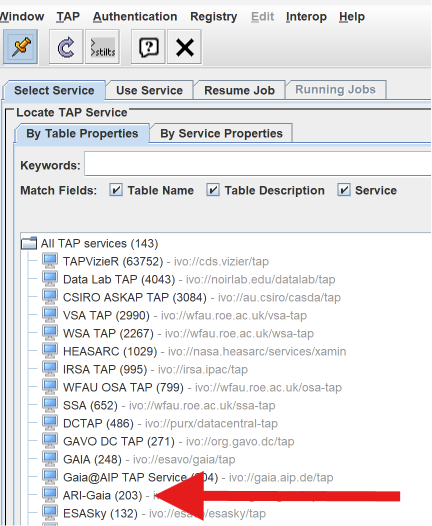
Select the ARI-Gaia service.
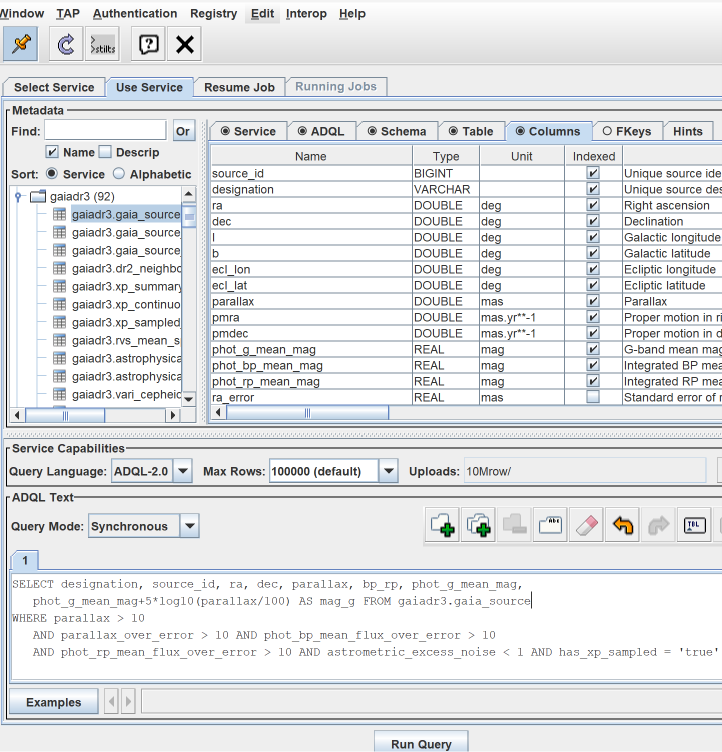
Enter the following ADQL query:
SELECT
    designation,
    source_id,
    ra,
    dec,
    parallax,
    bp_rp,
    phot_g_mean_mag,
    phot_g_mean_mag + 5 * log10(parallax / 100) AS mag_g
FROM gaiadr3.gaia_source
WHERE parallax > 10
    AND parallax_over_error > 10
    AND phot_bp_mean_flux_over_error > 10
    AND phot_rp_mean_flux_over_error > 10
    AND astrometric_excess_noise < 1
    AND has_xp_sampled = 'true'
Run the query and close the TAP window.
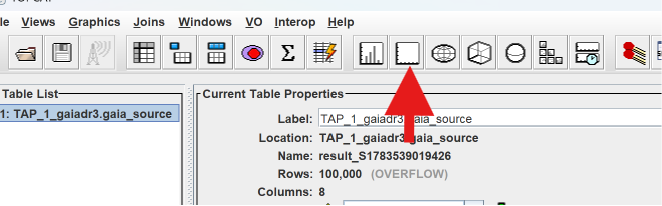
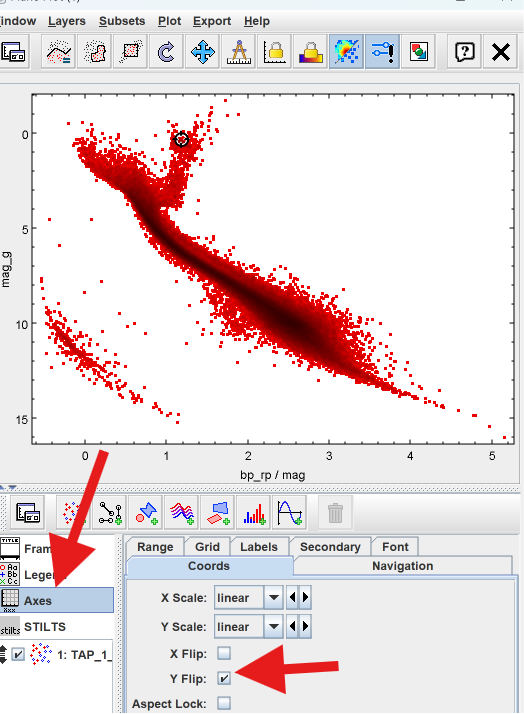
Next, create the H-R diagram using the Plane Plot.
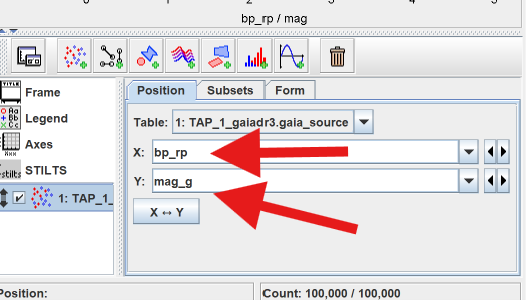
Set the axes as follows:
- X:
bp_rp - Y:
mag_g
Open the Axes tab and check Y Flip so that brighter stars appear near the top of the diagram.
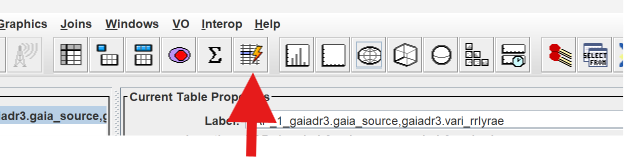
Next, open the Actions window.
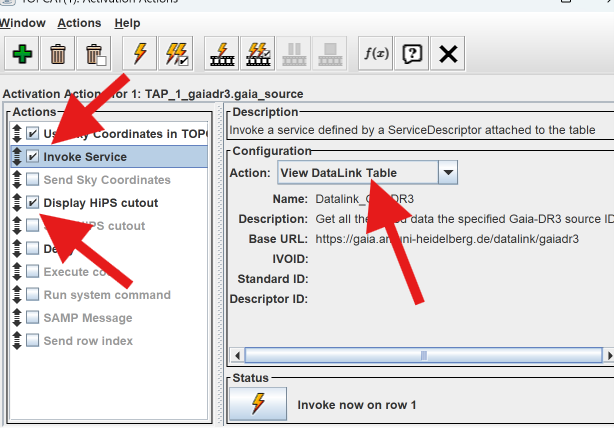
In the Actions window:
- Enable Invoke Service.
- Choose View DataLink Table as the action.
- Enable Display HIPS cutout.
Double-click your table to open it.
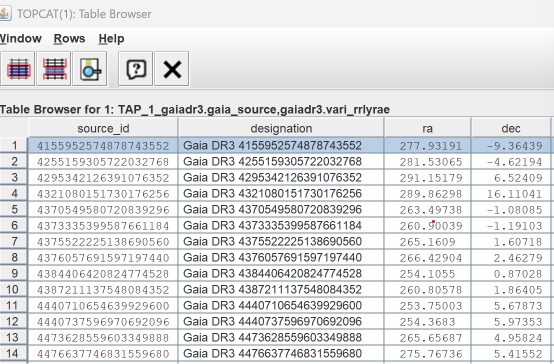
Click on any row in the table. The DataLink Table will open automatically.
In the DataLink Table:
- Select Externally calibrated … spectra.
- Set Action to Plane Plot Table.
- Check Auto-Invoke.
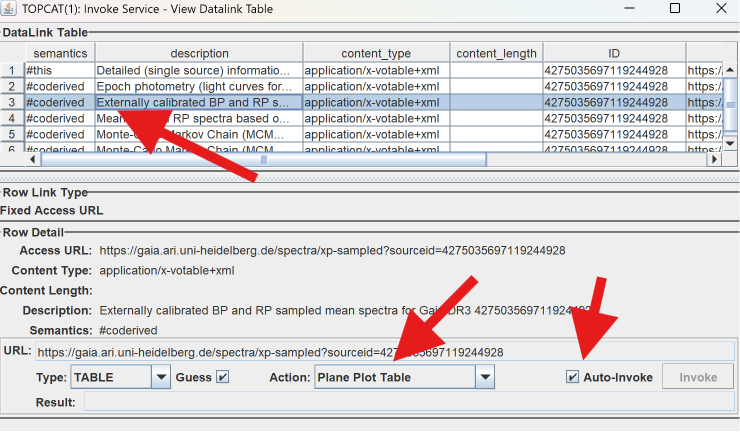
From this point on, selecting any star in the table will automatically:
- display its spectrum in the Plane Plot,
- show an image of the star centered in the image window,
- highlight the star’s position on the H-R diagram.
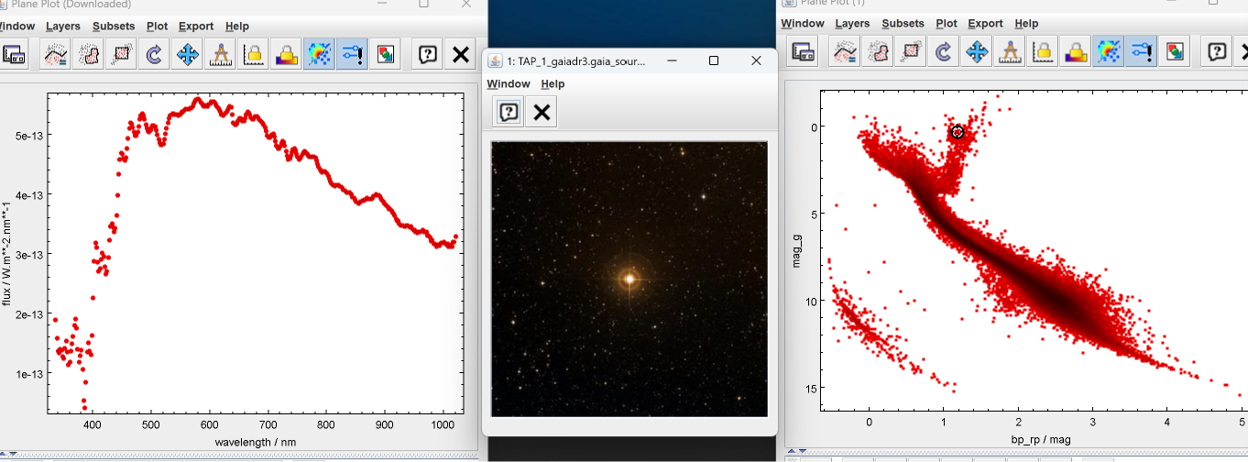
You can also click directly on any star in the H-R diagram to display its spectrum and image.
As an exercise, compare:
- a bright red star (upper-right region of the H-R diagram), and
- a bright blue star (upper-left region of the H-R diagram).
Notice how their spectra, colors, and locations on the H-R diagram are related.